EinsteinVision
Table of Contents:
- 1. Deadline
- 2. Problem Statement
- 3. Data
- 4. Checkpoint 1: Basic Features
- 5. Checkpoint 2: Advanced Features
- 6. Checkpoint 3: Bells and Whistles
- 7. Extra Credit: Cherry on Top
- 8. Hints, Tips and Tricks
- 9. Submission Guidelines
- 10. Allowed and Disallowed functions
- 11. Collaboration Policy
- 12. Acknowledgments
1. Deadline
11:59:59 PM, March 24, 2023 and 11:59:59 PM, April 01, 2023. This project is to be done in groups of 2 and has a 10 min presentation. Various checkpoints are due at different dates and are given below:
- Checkpoint 1 is due on 11:59:59 PM, March 24, 2023.
- Checkpoints 2 and 3 (and extra credit) are due on 11:59:59 PM, April 01, 2023.
2. Problem Statement
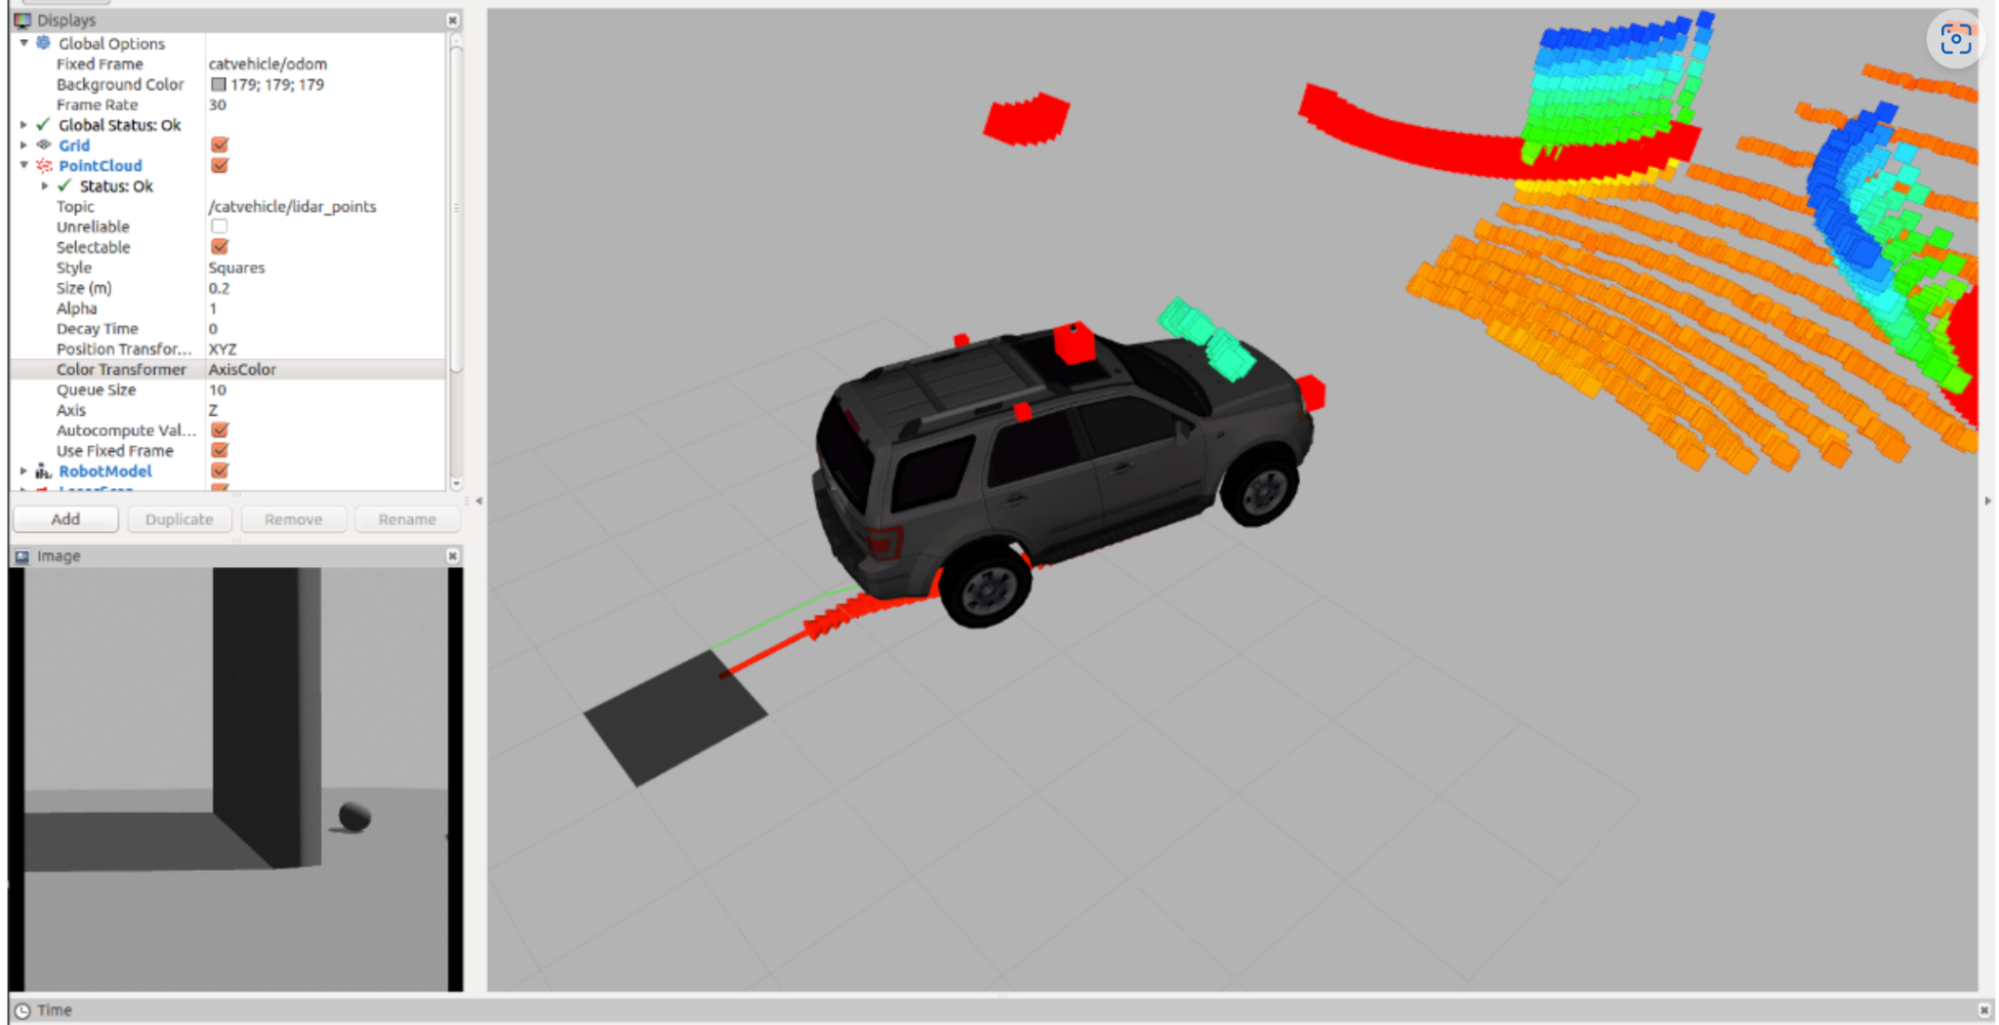
A key component of any product which a human has to interact with are beautiful visualizations. This is the first step for a human to build trust with an autonomous machine. For example, think of your first smartphone’s UI and compare it to how it looks now. This not only makes things easier to use but also more efficient and intuitive. In summary, a good visualization system takes in sensory information and provide intuitive insights into how the robot is thinking. Visualizations are not only important for debugging the issues in the software but they are also a basic Human Robot Interaction (HRI) problem as we mentioned before. One such classic visualization is the infamous rviz as shown in Fig. 1.
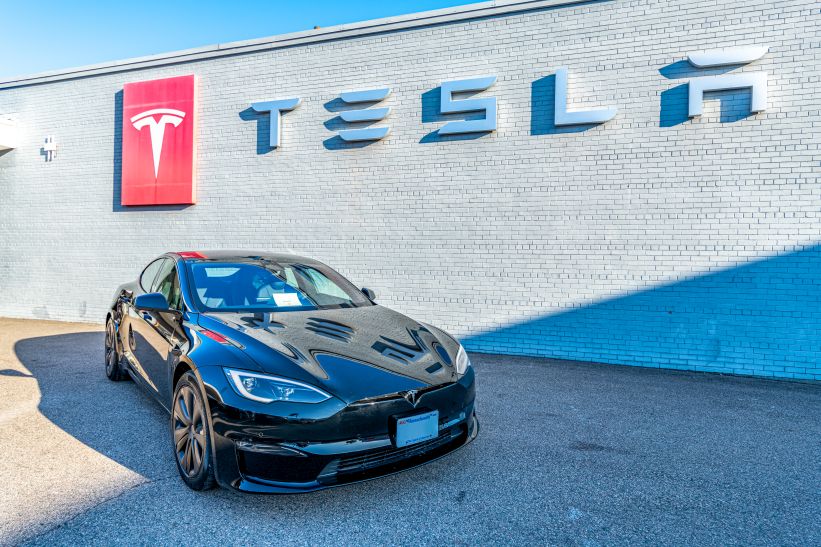
Another example of the visualization looks in a Tesla car is shown in Fig. 2.
Both rviz and Tesla’s earlier dashboards fail at the HRI problem, rendering (pun intended) it useless for common usage.
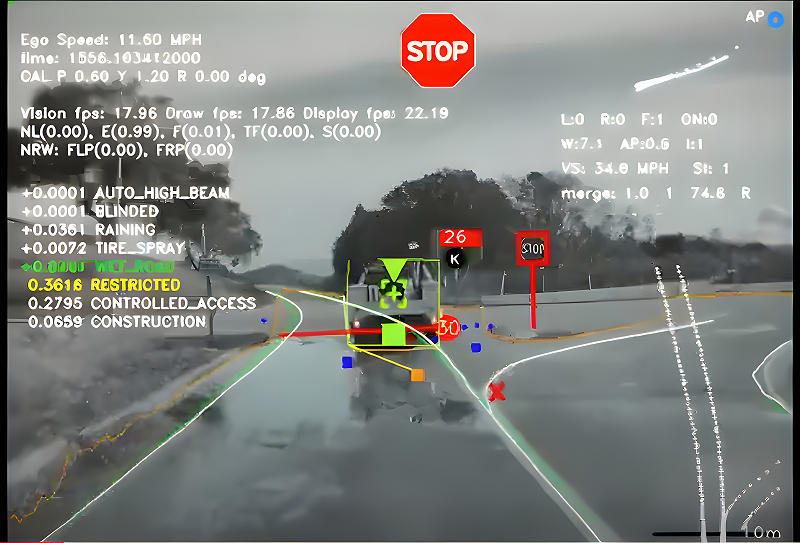
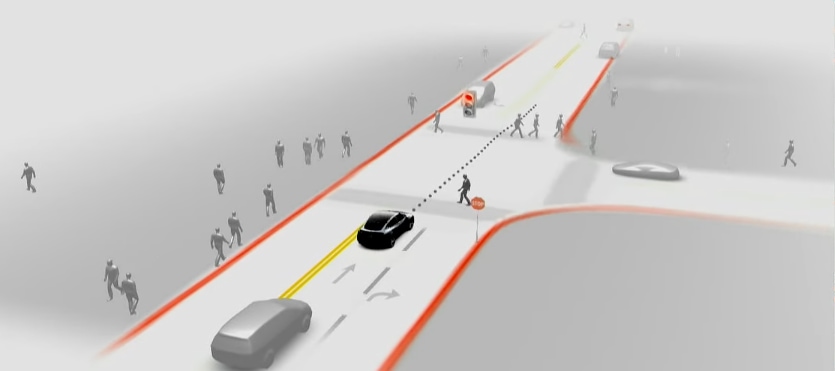
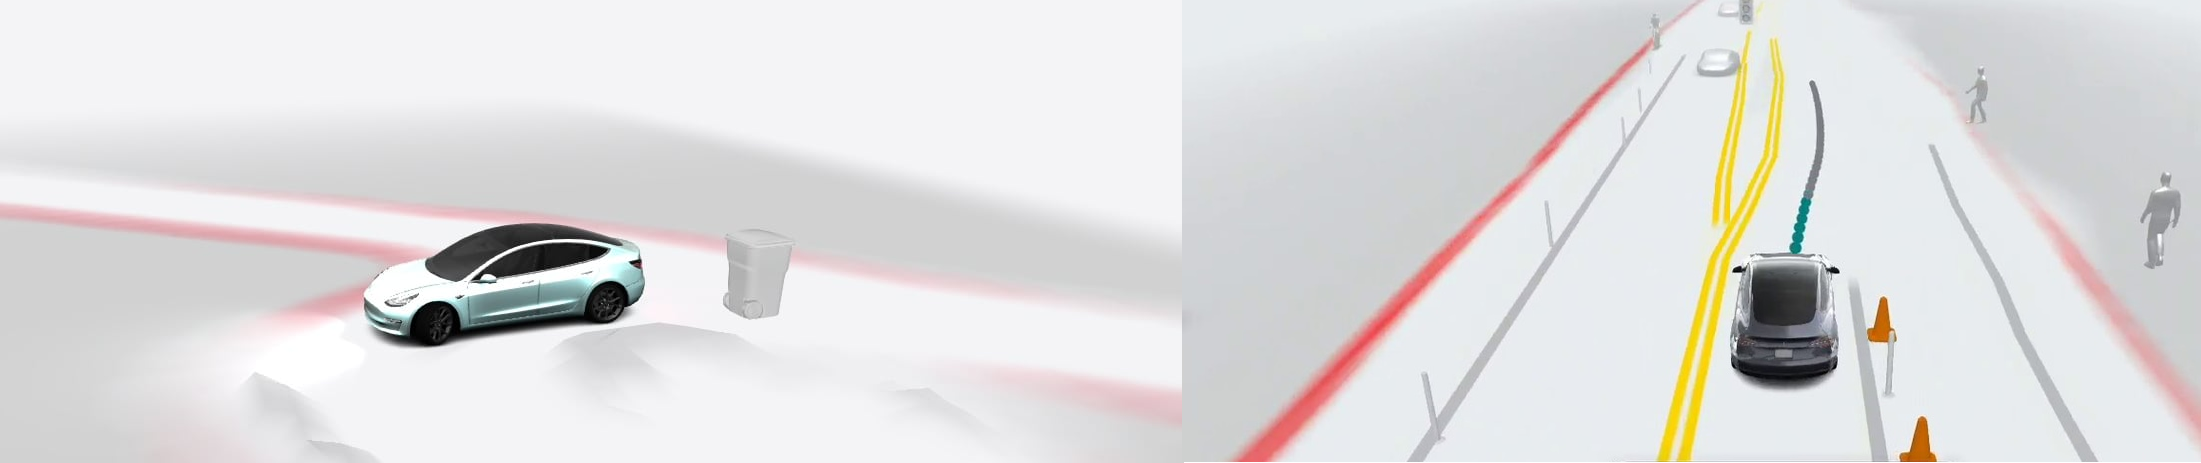
Tesla’s latest visualization (Fig. 3) is a really good example of visualization which provides a lot of intuitive insights about information it perceives.

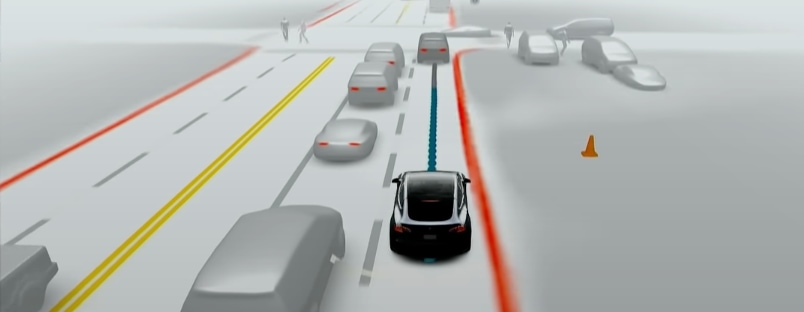
In this project, you will build an visualization inspired and bettered version of Tesla’s dashboard (see Vid. 1 and Fig. 3) and hence the name 😉, wherein you are provided with a set of videos recorded from cameras of a 2023 Tesla Model S (shown in Vid. 1). You are required to output a rendered video of your visualizations: atleast showing the view in front of the car and your car, you can also show everything around the car. You are free to use any approach (deep learning based or classical) available in the world and render the visualizations using Blender. This project is open-ended and hence there are multiple right solutions. You are graded for your creativity in approaching the problem, the effectiveness and prettiness of the visualizations.
Video 1: Video showing Tesla's FSD Visualization.
3. Data
Please download the data package from here. Also please watch this awesome Blender tutorial by Ramana. You can also download the tutorial from here.
The data given to you contains the following:
- Assets (Blender models in the
Assetsfolder) for various things like Cars: Sedan, SUV, Pickup truck, Bicycle, motorcycle, Truck, Traffic signal, Stop Sign, Traffic Cone, Traffic Pole, Speed Sign and Pedestrian. We also include texture images for stop sign and a blank speed sign (add your own speed as text here). - Videos (Undistorted and Raw in the
Sequencesfolder) for 13 sequences under various conditions with what scenarios are encountered in the respective markdown files in each folder. - Calibration Videos (in the
Calibfolder) used to calibrate the cameras.
4. Checkpoint 1: Basic Features
In this checkpoint, you are required to implement basic features which are absolutely essential for a self-driving car. We will describe these features next:
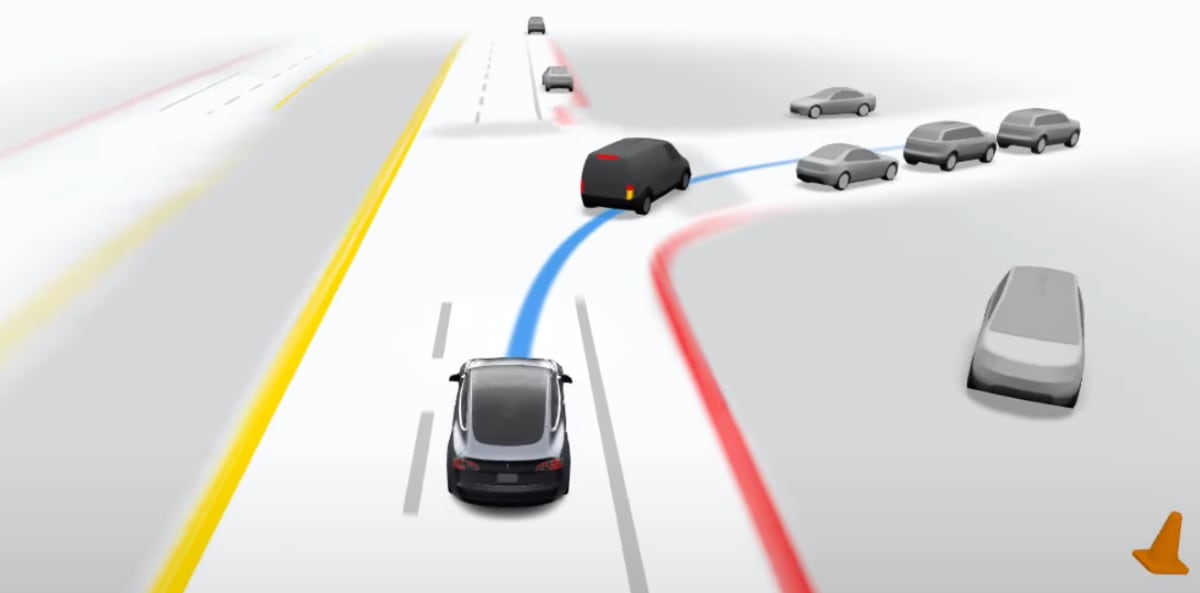
- Lanes: Identify and show the different kinds of lanes on the road, they could be dashed, solid and/or of different color (white and yellow). Each lane has significance and are essential to identify (See Fig. 5).
- Vehicles: Here, identify all cars (but you do not need to classify as different types) and represent them as a car shape (See Fig. 5, all your cars will look the same).
- Pedestrians: You need identify and locate pedestrians in the scene (See Figs. 5 and 6, all your pedestrians will look the same, i.e., they will face the same way).
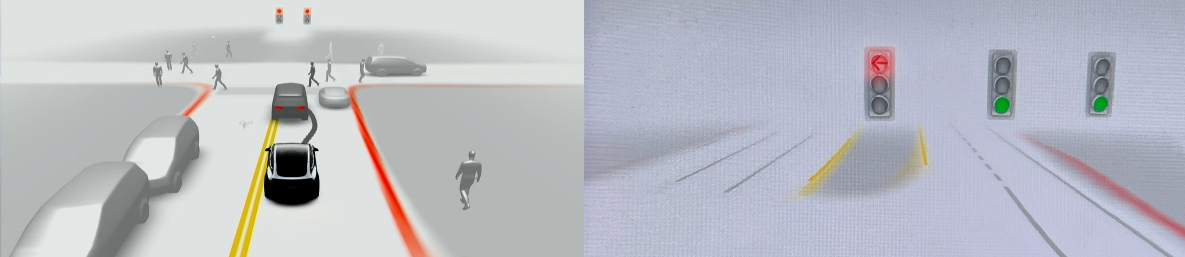
- Traffic lights: Indicate the traffic signals and it’s color (See Fig. 7, note that you do not need to classify arrows in the traffic signals here).
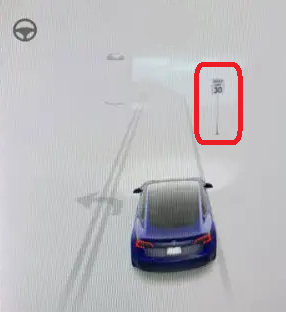
- Road signs: There are sign boards on the road you need identify and represent. In this checkpoint, you need to primarily indicate stop signs (Fig. 6) and speed limit signs (Fig. 8). The models and texture images are given separately and you need to apply the textures appropriately. The speed limit texture is blank and hence you need to add the numbers appropriately.
5. Checkpoint 2: Advanced Features
In this checkpoint, you will build on top of the previous one by enhancing and adding more features. Here, we add more granularity to the vision system which can aid in algorithmic decisions in navigation modules.
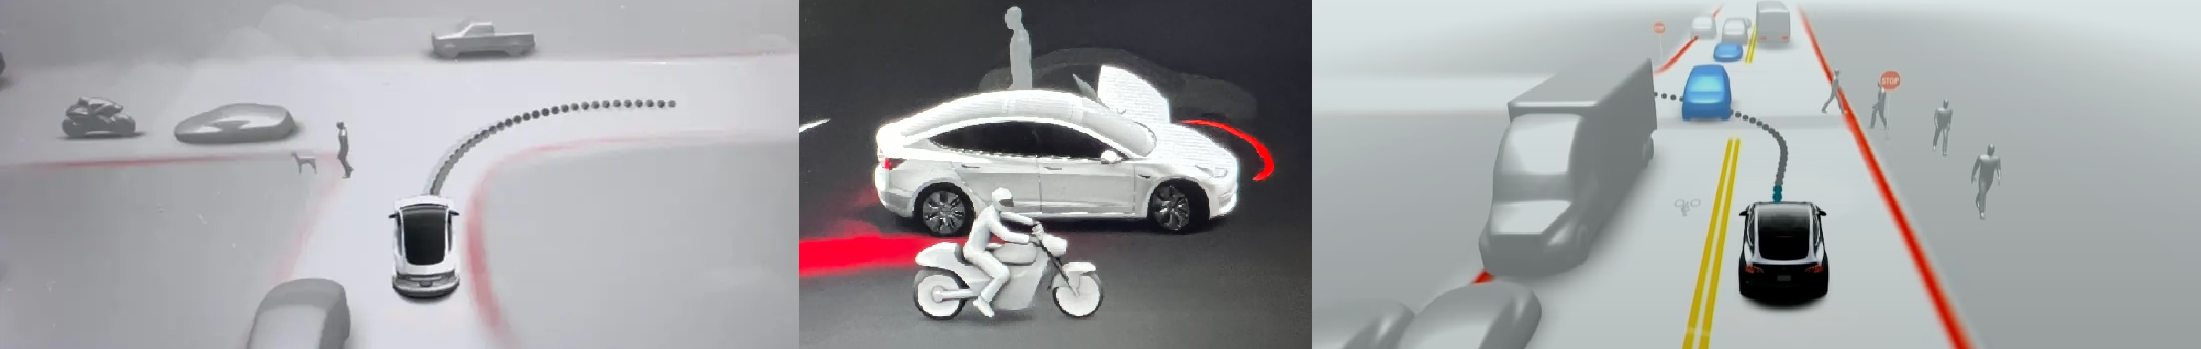
- Vehicles: Here, you need to classify (identify different vehicles) and subclassify them (identify different kinds of a type of vehicle). Note that you have to display these detections as the respective 3D model in your renders (See Fig. 9). More particularly,
- Cars: Sedan, SUV, hatchback, Pickup trucks
- Trucks
- Bicycle
- Motorcycle
- Traffic lights: Additionally to the previous checkpoint, classify arrows on the traffic lights here (Fig. 7).
- Road signs: Along with the previously mentioned sign boards, you should also indicate road signs on the ground such as arrows (See Fig. 6).
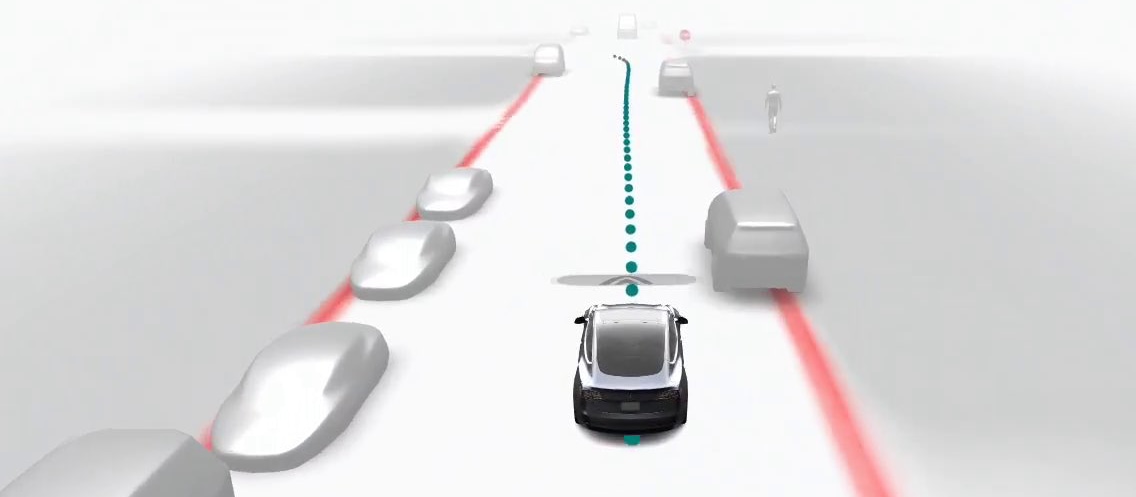
- Objects: You also need to indicate additional objects like dustbins, traffic poles, traffic cones and traffic cylinders as their respective 3D models in the renders (See Fig. 10).
6. Checkpoint 3: Bells and Whistles
In this checkpoint, we try to add further cognitive abilities for better decision making in our planning stage.
- Break lights and indicators of the other vehicles: Identify and display the vehicle break lights and indicator signals (See Fig. 11). This helps the navigation module in making better lane changing decisions.
- Pedestrian pose: You need to identify pedestrian pose each frame instead of just classifying them and display them (See Fig. 6).
- Parked and Moving Vehicles: Distinguish between parked and moving vehicles and display (make it subtle but identifiable).
7. Extra Credit: Cherry on Top
Implementing the extra credit can give you upto 25% of bonus score. Like a cherry on the top, you need to identify and indicate:
- Speed bumps: (See Fig. 12) This accounts for 10% of bonus score. No asset is given for this. Feel free to make your own.
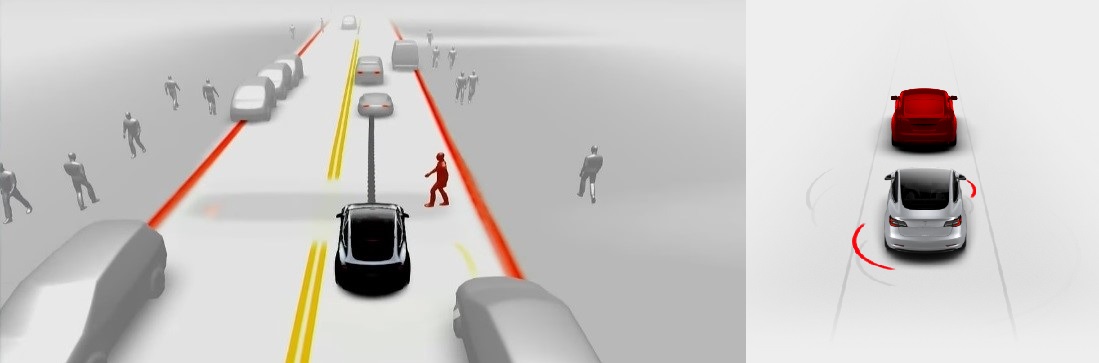
- Collision prediction of pedestrians or other vehicles as red highlight: (See Fig. 13) This accounts for 15% of bonus score. This is as simple as changing the material color when the crash is detected.
8. Hints, Tips and Tricks
This project involves a lot of concepts from various aspects of computer vision and robotics. Here are a few tips that can get you started:
- Refer to websites like Papers with code to obtain a collated list sorted by accuracy for research papers of computer vision tasks.
- Ensure that object detection/recognition/segmentation models were trained on North American datasets as the data you are given is from the United States.
- Do not worry about inference speed or the number of models used (feel free to use multiple to boost accuracy of a single task) for this project.
- Try to refrain from training your own models unless absolutely essential. The goal here is also to learn how to design a system with pre-trained models and making the algorithm work in context of any problem.
- Sometimes, a very trivial method (such as color thresholding) could be used to solve the problem. Think creatively and do not be bound by how other people solve the problem.
- Here are a few keywords that can aid in finding methods to help solve the problems:
- Monocular depth estimation: Can be utilized to obtain relative scale of objects.
- Absolute scale estimation using road markers: You can use sizes of “known” objects on the roads such as signboards, other cars and so on to normalize scale across frames.
- Object Detection and Classification: Can aid in detecting and sub-classifying objects.
- Pose estimation: Depending on the scenario, you can use this to estimate pose of pedestrians, other objects and/or the motion of your camera.
- Optical Flow: This is how pixels have moved between two image frames. Can help in classifying motion.
9. Submission Guidelines
If your submission does not comply with the following guidelines, you’ll be given ZERO credit.
9.1. Checkpoint 1 Submission
You’re required to submit two sets of things all zipped into a folder called YourDirectoryID_p3ph1.zip on Canvas and have a meeting with the course instructors as described below.
- Rendered images of various cases as
png/jpgimages. Feel free to have as many images as you want to show the cases we requested for in Phase 1 (Lanes, Vehicles, Pedestrians, Traffic lights, Road signs and speed limit signs). - A small
.mdfile calledReferences.mdwith the packages you used for your implementation along with one sentence of how you used it. - Meet the instructors on Monday, March 27th from 2PM to 4PM in UH250E to discuss your progress and approach.
Note that, you CAN use late days for the submission but the instructor meeting time is fixed. This checkpoint accounts for 30% of the project grade.
9.2. Final File tree and naming
Your submission on ELMS/Canvas must be a zip file, following the naming convention YourDirectoryID_p3.zip. If you email ID is abc@wpi.edu, then your DirectoryID is abc. For our example, the submission file should be named abc_p3.zip. The file must have the following directory structure. Please provide detailed instructions on how to run your code in README.md file.
NOTE: Please DO NOT include data in your submission. Furthermore, the size of your submission file should NOT exceed more than 500MB.
The file tree of your submission SHOULD resemble this:
YourDirectoryID_p3.zip
|   ├── Code
|   |   └── Any subfolders you want along with files
|   └── Videos
|       ├── OutputVisualizationVideoSeq1.mp4
|       ├── ....
|       └── OutputVisualizationVideoSeq13.mp4
├── Report.pdf
├── Presentation.pdf or Presentation.pptx
└── README.md
The OutputVisualizationVideoSeq1.mp4 is the output of your rendered visualization for Seq1 (or scene1). You’ll have 13 such videos, one for each sequence.
9.3. Final Report
For each section/checkpoint of the project, explain briefly what you did, and describe any interesting problems you encountered and/or solutions you implemented. You must include the following details in your writeup:
- Your report MUST be typeset in LaTeX in the IEEE Tran format provided to you in the
Draftfolder and should of a conference quality paper. - Present sample visualization examples for each of the cases in every single checkpoint.
- Talk about the approach you took (as detailed as possible) to solve the problem with appropriate citations and explanations.
- Talk about the problems or corner cases where your approach would not work.
- Talk about how you would make your approach better.
- Talk about challenges you faced during in project and feedback on what can be improved further.
9.4. Final Presentation
You are required to do an in-person presentation for 10 mins (all team members MUST present) during the time decided (look out for a post on timings on Piazza) explaining your approach, the results as video. Explain what all problems you tackled during this project and how you overcame them. Further, talk about non-obvious observations, corner cases and failure modes along with potential ways to solve them. Also, give an in-depth analysis of your proposed approach. The presentation has to be professional of a conference quality presented to a wide range of audience ranging from a lay-person to an expert in the field.
10. Allowed and Disallowed functions
Allowed:
- Absolutely anything in the world!
Disallowed:
- Absolutely nothing in the world!
If you have any doubts regarding allowed and disallowed functions, please drop a public post on Piazza.
11. Collaboration Policy
NOTE: You are STRONGLY encouraged to discuss the ideas with your peers. Treat the class as a big group/family and enjoy the learning experience.
However, the code should be your own, and should be the result of you exercising your own understanding of it. If you reference anyone else’s code in writing your project, you must properly cite it in your code (in comments) and your writeup. For the full honor code refer to the RBE/CS549 Spring 2023 website.
12. Acknowledgments
The beautiful visualizations are from Tesla’s products and a lot of the images are adapted from here.